Use AI to analyse ad results and challenge premature conclusions
Analyse 200 exposures and 75 events with worked AI examples, revise for a refund, then correct unsupported advice on a fresh campaign.
About 50 min readingAs of Oct 2026
Lesson guide · goals & preparation
By the end of this guide
- Supply exposures and events with explicit denominator, duplicate and time-window rules.
- Revise both counts and decisions when a refund arrives.
- Challenge assumptions in added statistical advice and reuse the request on fresh data.
Who this is for
- Readers who use AI on campaign tables but want to verify counts and conclusions.
- Readers learning from concrete prompts and revisions without specialist jargon.
What you need
- Foundations on comparison or the introductory campaign lesson are helpful.
- No ad account, spending or customer data is required. Read the supplied material or optionally try a chat tool.
This lesson’s terms, in plain language
Read the short meanings here. Open a term for a fuller explanation and example.
This reading lesson explains how to use external AI tools. Read from theory to the workflow, examples and explanations, or use the contents to jump to a section.
1 / 4
Theory
Understand what to ask AI to do, how to ask, and the ideas behind the workflow.
Before asking AI for a winner, specify the evidence you need
Asking which ad won may produce a confident explanation of the larger percentage. Duplicated purchases or different delivery windows can invalidate that conclusion. Here AI helps clean records, identify comparison limits and revise a decision memo.
The workflow to understand is: Separate exposures from events → align periods and counting units → request a comparison with evidence → check sample size and uncertainty → revise interpretation with new conditions such as refunds. First learn why each input and constraint matters, then study the requests, finished examples and explanations. This is a reading lesson about external AI tools; no account or runtime is required.
A and B label fictional storage-product ads. One file records exposed users; the other records click and purchase events. An event row is not necessarily a different person, so distinguish rows, users and purchases from the beginning.
Ask the assistant to read evidence, explain denominators and draft a report. Recalculate separately. If it introduces statistical jargon, ask which data and assumptions support it. Later we examine an actual response that recommended an inadequately explained sample size and have it withdrawn.
On October 28, 2026 we ran Claude Sonnet 5.5 with CSV text and tools disabled, added a refund in the same chat, and used a fresh chat for another campaign. Unchanged response extracts are labeled separately from editorial calculations. No real ads or customer experiments were run.
Trying a tool is optional. Attach the CSVs or paste the complete input text in the download. The important skill is connecting input, rules, output and review, not memorising a particular button position.
Explain the exposure file and the event file separately
The exposure file has 200 rows: A001–A100 and B001–B100, each once. The 75 event rows omit people who did nothing. Supplying only events would lose the correct denominator, so send both files and keep inactive exposed users.
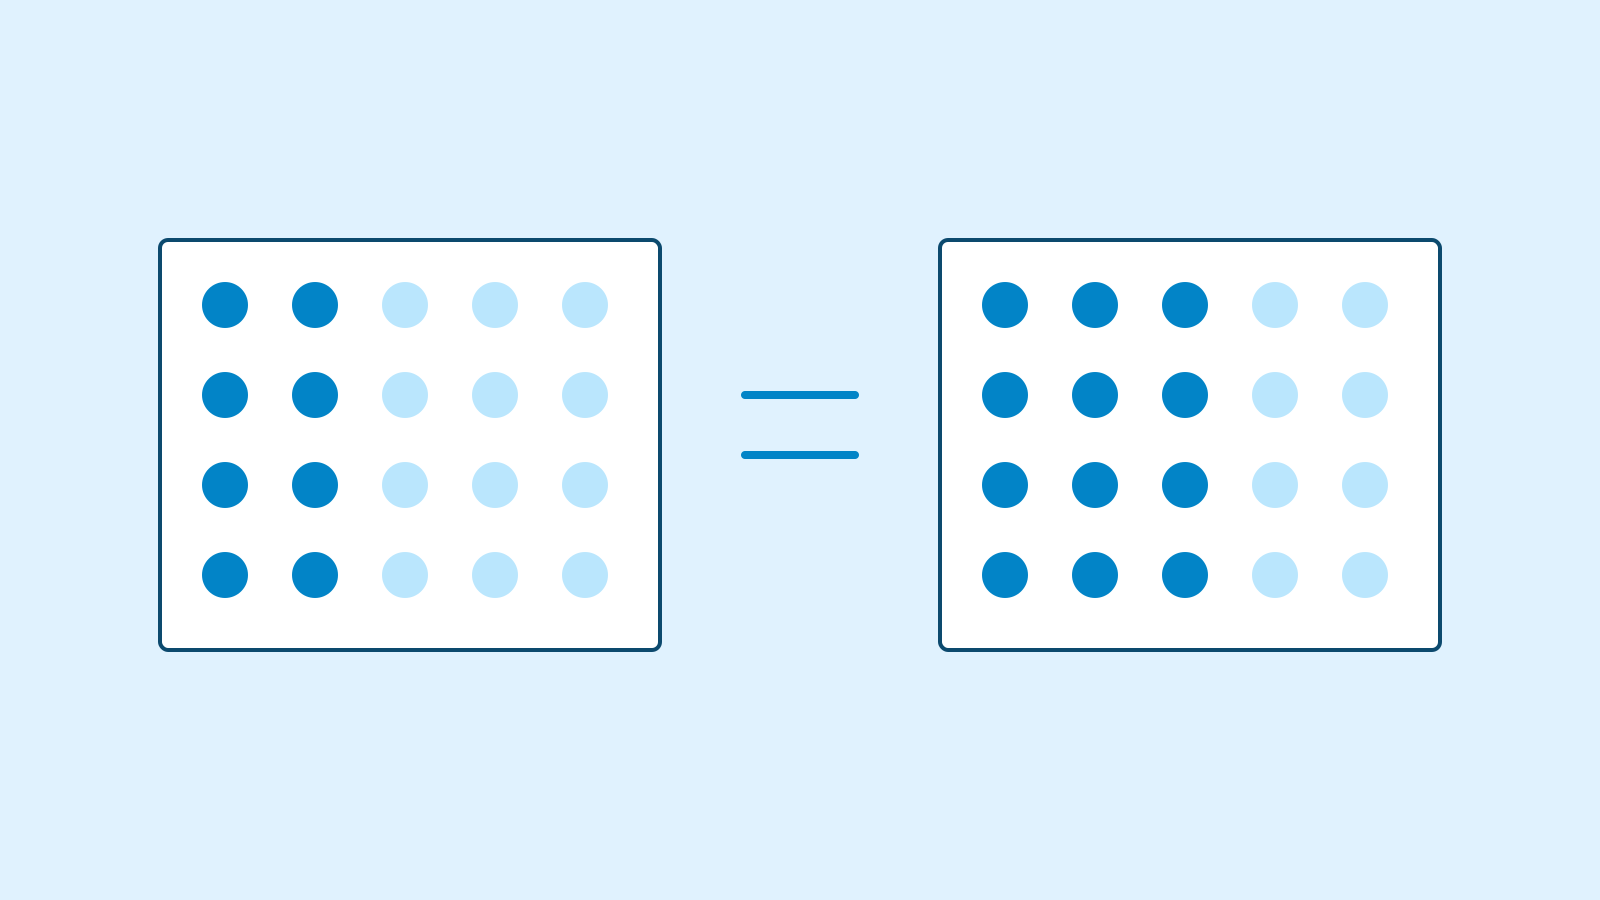
Figure: Two ad groups and their exposure conditions sit side by side for comparison · AI Ping event_id identifies a repeated action record; user_id identifies a person. A has 26 raw click rows but 25 people after removing the repeat C-A001. B has 33 click rows but 30 people after three repeats, and 11 purchase rows including a repeated P-B003.
The primary outcome is a paid purchase on day 0 through 7 inclusive. P-B009 and P-B010 occur on days 8 and 9. Keep them visible outside the primary metric. Expanding the window after seeing the result would change the question.
A ran at 08:00–10:00 and B at 18:00–20:00, with nonrandom time-window assignment. Those fields do not enter simple arithmetic but constrain interpretation: time and audience differences cannot be separated from copy.
The table summarises every file and exceptional ID; downloads contain all records used in the run. For your own data, specify observation, refunds and cross-group users explicitly. These teaching rules are not claims about platform defaults.
Fictional campaign 1 source structure and exceptional records Item A B Distinct exposed users 100 100 Raw click rows → distinct people 26 → 25 33 → 30 Raw purchase rows → distinct events 5 → 5 11 → 10 Repeated event_id C-A001 C-B001; C-B002; C-B003; P-B003 Purchases outside 7 days None P-B009(day 8); P-B010(day 9) Window / assignment 08:00–10:00 / nonrandom 18:00–20:00 / nonrandom
2 / 4
Step-by-step use
Learn what to prepare, how to request help and how to revise the result through examples and explanations.
A copyable request for numerators, denominators and excluded IDs
You may begin by asking for filenames, row counts and column meanings. Correct any claim that 75 event rows mean 75 people before sending the full request. Its separate clauses address source roles, metrics, duplicate keys, observation window, refunds and output form.
The displayed Korean request assumes attachments. The recorded run appended the full CSV text to English instructions. The download includes complete Korean input and the original English version for tools without attachments. A filename alone does not supply a file; if reading fails, paste text instead of asking the assistant to guess.
Name each metric and show its numerical denominator. Click rate uses distinct clickers over exposed users. The primary purchase rate uses eligible purchasers over exposed users. Five over 25 is a different conditional measure from five over 100.
Separate duplicate-event removal from person counting. The assistant removed five repeated rows, leaving 70 events. Two late purchases remain in that table but are excluded from the primary metric. Cleaning a file and selecting a metric's numerator are different operations.
Request tables and IDs before the decision memo. Even a cautious prompt does not eliminate unsupported additions: the actual response supplied an approximate interval we had not requested. The next sections show how we inspected that addition rather than pasting it into the final report.
Example prompt Read the attached campaign-1-exposures.csv and campaign-1-events.csv. These are invented teaching data. Use paid purchasers on days0–7 per distinct exposed user as the primary metric. Deduplicate event_id, count people by user_id, exclude refunded purchases and keep late purchases visible. Show file counts, excluded IDs, numerators and denominators for clicks and purchases, then a Korean and English decision memo. Respect time-window and assignment limitations. Do not launch ads.
Read the recorded answer without turning a higher rate into a winner
The first run returned A 25 clickers and 5 eligible purchasers, B 30 clickers and 8 eligible purchasers. Each denominator is 100, giving 25%/30% click rates and 5%/8% purchase rates. B's 11 raw purchase rows would incorrectly yield 11%. The table below was independently recomputed from CSV.
The actual memo withheld a winner. It did not erase the observed three-person, three-percentage-point difference. It retained the difference while declining to assign its cause to copy. A percentage point is the subtraction of two percentages; actual counts help avoid exaggerated framing.
Inspect the excluded IDs: R026 repeats C-A001, R062–R064 repeat B clicks, and R075 repeats P-B003. R073/R074 are late purchases. Specific IDs let a colleague inspect exports; 'noise removed' does not.
Different time windows are an observed limitation, not a blank to fill. Asking AI to rewrite them as matched would invent an experiment. Preserve the first analysis and use a separate campaign for improved conditions.
Try writing one conclusion yourself: B has three more observed purchasers among 100, but timing and assignment differ. Save the raw answer alongside that review. A later refund can then be applied to specific numbers and reasoning rather than generating an unexplained replacement report.
Worked example & explanation Unchanged extracts from the first Claude Sonnet5.5 response · 2026-10-28
Example responseA teaching example of a workflow in an external AI tool. Results vary with the request and context.
The primary metric is 8 of 100 users for B versus 5 of 100 for A, a gap of 3 users (3 percentage points).
(…)
This data does not support calling B better, and I recommend holding off on a rollout.
Independent editorial check: campaign 1 Metric A B Exposed users 100 100 Click rate 25/100 = 25% 30/100 = 30% 7-day purchase rate 5/100 = 5% 8/100 = 8% Decision Timing differs; cause unresolved Timing differs; cause unresolved Add a refund and update the memo in the same conversation
Audit AUD1 arrives after the analysis: purchase P-B008 by user B008 was refunded. Preserve the initial paid record and add a versioned update. Specify that event and leave unrelated rows unchanged.
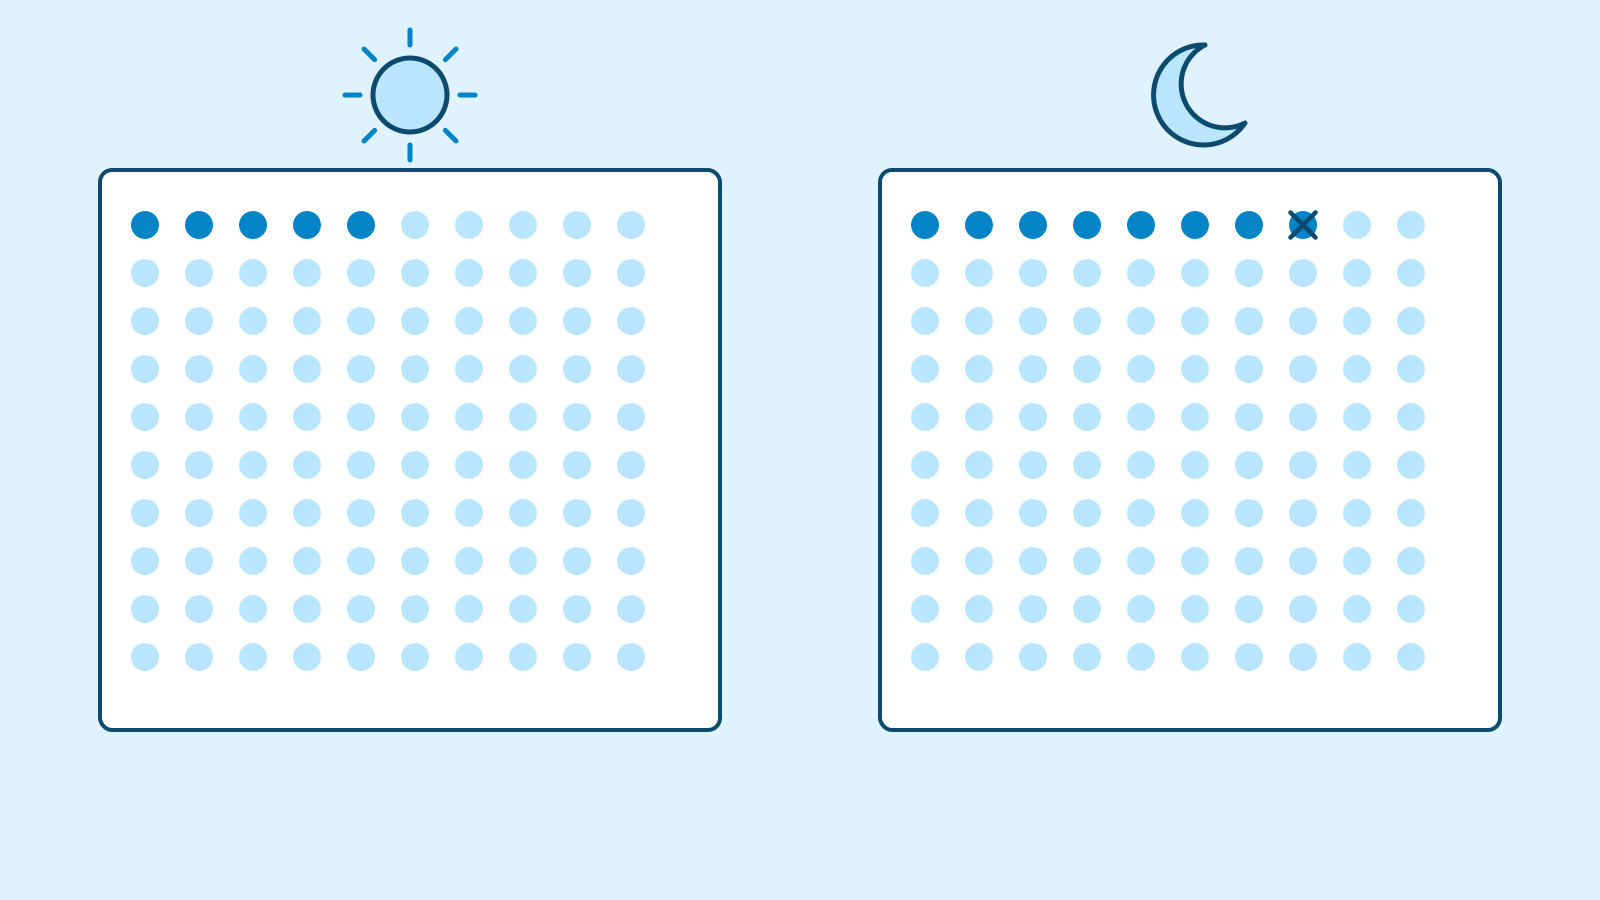
Illustration: among one hundred each, A has five buyers and B changes from eight to seven after refund; time windows still differ · AI Ping Request updated eligible counts, rates and before/after differences, plus whether timing confounding has disappeared. It has not. B moves 8→7 purchasers and 8%→7%; A stays 5 and 5%. The gap narrows 3→2 people while exposure and click counts remain unchanged.
The actual response mapped R072/P-B008 from paid to v2 refunded. It retained distinct exclusion reasons for that refund and the day 8/day 9 purchases. IDs and reasons are more useful than an unexplained 'three excluded'.
The follow-up also prohibited invented significance tests. The response withdrew its earlier approximate interval because the random-assignment premise did not fit. Correct counts and unsupported statistical interpretation were handled separately; the whole answer did not have to be accepted or discarded.
Check the title and decision as well as tables. A 'B wins' headline would still mislead even after cautious body text. Ask AI to revise the memo and next actions together. No live account changes or advertising spend are required.
Example prompt New fictional audit: AUD1 says purchase P-B008 was refunded. Change its status to refunded, keeping the previous version. Update eligible purchase counts and rates, show the delta, and revise the decision memo in Korean and English. Explain whether time-window confounding disappeared. Do not invent a significance test.
Worked example & explanation Unchanged follow-up extracts
Example responseA teaching example of a workflow in an external AI tool. Results vary with the request and context.
Time window still coincides entirely with variant, and assignment is not random.
(…)
No significance test was run and none is used as a basis. The approximate interval in the previous memo assumed random assignment that does not hold, so it is withdrawn here rather than recomputed.
Inspect the assumptions behind statistics the assistant adds
Claims such as 'statistically significant' or 'about 1,200 people needed' can sound authoritative. A sample plan needs an expected difference and tolerated errors. The actual fresh-case response offered such a recommendation without adequate explanation; we requested its withdrawal rather than teaching it as an answer.
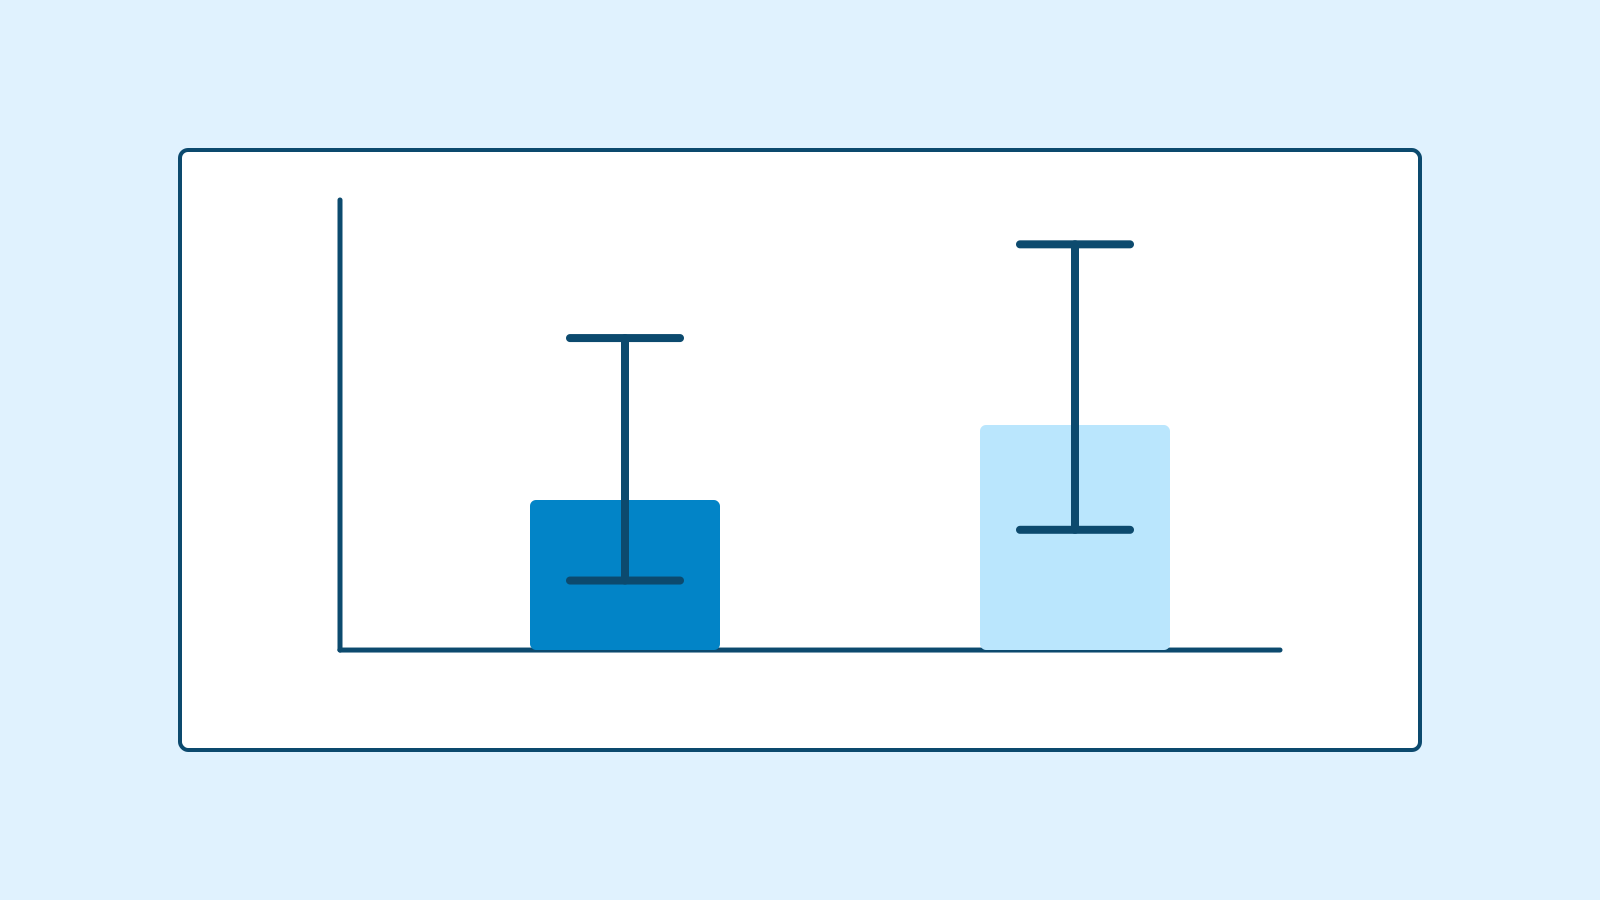
Figure: Bars for the fresh campaign purchase rates 6% and 9% with each group’s own 95% Wilson interval · AI Ping For the next case, A has 6 purchases out of 100 and B 9 out of 100. Using NIST's Wilson formula with z=1.96, independent editorial calculations give A 2.78–12.48% and B 4.81–16.23%. These describe the fictional data, not measured customer results.
Wide intervals caution against treating 6% or 9% as precise constants. Overlap does not establish equality: these are individual-proportion intervals, not a test of the difference. A 95% confidence procedure describes repeated-sampling coverage, not a 95% probability assigned to a fixed parameter after calculation.
You do not need to memorise the formula. Ask AI to separate the method, numerators, denominators, assumptions and conclusions it cannot support. Compare numbers with independently checked files and retain unresolved assumptions. This does not automatically complete sample planning or budget decisions.
NIST's experimental-design guidance begins with objectives. Likewise, do not choose the most flattering metric or observation window after seeing results. AI can draft a plan, but the owner should be able to explain its criteria before collecting new data.
3 / 4
Check & explain
Think about what you would ask AI, then read the explanation. Written submissions and external AI use are optional.
This is a learning check, not a test you must pass. Use the explanations to understand the ideas.
Q1How do duplicate P-B003 and the day 8/day 9 purchases change B’s 11 raw rows and primary rate?
Write your thoughts (optional)
Your writing is not sent anywhere. It disappears when you leave or reload this page, so copy anything you want to keep.
Read the answer and explanation
Removing the repeated event leaves 10 events; retain but exclude the two late purchases from the primary numerator. Eight distinct eligible purchasers among 100 give 8%. Eleven or 10% answers a different question; all values are fictional.
This is your own review, not an automatic score.
Q2After AUD1, B is 7% and A 5%. What do you ask if AI claims the timing limitation is fixed?
Write your thoughts (optional)
Your writing is not sent anywhere. It disappears when you leave or reload this page, so copy anything you want to keep.
Read the answer and explanation
Explain that the refund changes outcomes, not the 08:00–10:00 versus 18:00–20:00 assignment. Request a memo separating numerical revision from unchanged conditions. Two more observed purchasers do not identify a copy effect.
This is your own review, not an automatic score.
Q3AI computes A’s purchase rate as 5/25=20%. Why is that not the primary metric despite correct arithmetic?
Write your thoughts (optional)
Your writing is not sent anywhere. It disappears when you leave or reload this page, so copy anything you want to keep.
Read the answer and explanation
Twenty-five counts clickers; the primary denominator is 100 exposed users. Label 5/25 as purchase among clickers and 5/100 as purchase among exposures. Changing denominators without changing the label changes the comparison.
This is your own review, not an automatic score.
Q4What rates and individual Wilson 95% intervals follow from campaign 2/META2, and how was the 1,200-per-arm advice handled?
Write your thoughts (optional)
Your writing is not sent anywhere. It disappears when you leave or reload this page, so copy anything you want to keep.
Read the answer and explanation
A is 6/100=6% with 2.78–12.48%; B is 9/100=9% with 4.81–16.23%. Individual intervals are not a difference test or proof of equality. We requested withdrawal of inadequately explained sample-size advice and did not pool campaign 1.
This is your own review, not an automatic score.
Common mistakes
- Counting purchase rows as different purchasers.
- Attributing a higher rate directly to copy.
- Using AI-proposed sample sizes or p-values without inspecting assumptions.
Your learning record
Completion is optional. Mark this lesson when you feel ready, or move to the next lesson without marking it.
Completion is saved in this browser.
4 / 4
Apply to your work
Consider how new material changes the workflow and checking criteria. Trying an external AI tool is optional.
Try it: analyse a fresh campaign and correct an overreaching recommendation
Campaign 2 is separate: both creatives share 08:00–20:00 and the same audience definition, with simulated balanced random assignment to 100 users each. Do not pool it with the first confounded campaign. In a new chat, supply only the new files and reusable metric rules.
There are 67 events: 52 clicks and 15 purchases, with no duplicates, refunds or late events. The first response correctly counted A 24/6 and B 28/9, but asked whether later user IDs lacked events because of an incomplete export and whether seven-day observation had finished. Those are useful completeness questions.
Additional source META2 confirms full exports, complete observation and zero activity for users without events. We also asked it to withdraw inadequately explained power, p-value and 1,200-per-arm recommendations. The follow-up separated new facts from the reason for rejecting unsupported advice; both raw versions remain downloadable.
The revised response retained 6 and 9 purchases, distinguished resolved questions from limits, and used the independently supplied individual Wilson intervals without presenting them as a difference test. It left design choices to be specified instead of prescribing an ungrounded campaign duration or sample size.
Try counting users before opening the answer. Even when counts match, inspect the recommendation's assumptions. Completion means explaining 6%/9%, keeping campaigns separate and retaining uncertainty—not claiming a verified advertising effect. Save sources, prompts, raw responses, revisions and checks together.
Fresh check: campaign 2 independent results and META2 Metric or condition A B Exposed / clicked / paid 100 / 24 / 6 100 / 28 / 9 Click / primary purchase rate 24% / 6% 28% / 9% Individual 95% Wilson interval 2.78–12.48% 4.81–16.23% Observation/completeness All 200 completed 7 days; full export No event means no activity Decision Do not pool with campaign 1 Intervals are not a difference test Download practice files and original prompts
Example prompt Analyse only the campaign 2 unseen exposures and events, using the same primary metric, without pooling campaign 1. After the initial response, supply META2: all 200 users completed 7 days; exports are complete; absent events mean inactivity. Withdraw inadequately explained power, p-value and sample-size advice. Use independently calculated individual Wilson 95% intervals A 2.78–12.48%, B 4.81–16.23%, not as a difference test. Separate changed evidence from preserved counts.
Worked example & explanation Unchanged extracts after reviewing the fresh conversation
Example responseA teaching example of a workflow in an external AI tool. Results vary with the request and context.
Overlapping intervals do not mean the groups are the same, and they do not show B is better. This data alone supports neither conclusion.
(…)
This memo is a re-analysis of the supplied fictional data. No new experiment was run.
Write a note (optional)
Use this only if you want to record a prompt or your understanding. This is a notebook, not a connected AI assistant.
Your writing is not sent anywhere. It disappears when you leave or reload this page, so copy anything you want to keep.
References
- Confidence intervals for a proportion — NIST/SEMATECH e-Handbook
- What are the objectives? — NIST/SEMATECH e-Handbook
- Upload files to Claude — Claude Help Center